grafana dashboards to monitor your azure services
On November 2017, the Grafana plugin to monitor your Azure services was announced in Preview.
As a reminder, Grafana is a very popular open-source project listed in the CNCF landscape.
The Grafana Datasource could be configured with either Azure Monitor, Log Analytics or Application Insights to display then metrics of your Azure services.
You could follow this tutorial to monitor your Azure services with Grafana or the official Grafana page about this Azure Monitor plugin to get started and build your own Grafana dashboards.
FYI, the associated GitHub repo could be found here.
I recently gave it a try to quickly host my Grafana server with the Azure services plugin on an Azure Container Instance (ACI) instead of the VM proposed by the two documentations described above.
Note: you could also deploy it on Azure Web App for Containers, on your Azure Kubernetes Service cluster, etc.
Here is how I accomplished this:
RG=<your-rg-name>
LOC=eastus
ACI=<your-aci-name>

az group create \
 -l $LOC \
 -n $RG

az container create \
 -g $RG \
 -n $ACI \
 -l $LOC \
 --image grafana/grafana:latest \
 --ip-address public \
 --ports 3000 \
 -e GF_INSTALL_PLUGINS=grafana-azure-monitor-datasource
It is recommended that you use a volume to save the Grafana data in. Otherwise if you remove the docker container, you will lose all your Grafana data (dashboards, users etc.).
Then I created a dedicated Service Principal with the Reader role for the setup of the Azure Monitor and Log Analytics datasources and also an Application Insights Key with the Reader role too for the Application Insights datasource. All of this is described with the two tutorials above.
Finally, I was able to setup some panels leveraging the available metrics to create my dashboard:
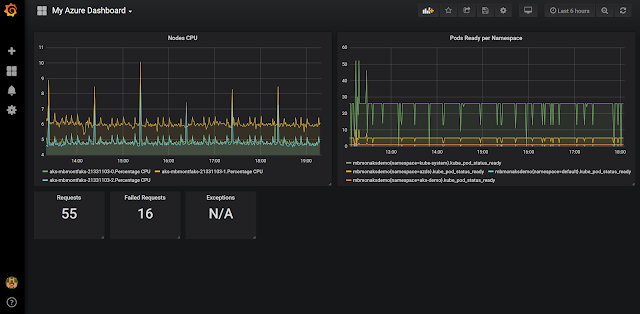
For the Log Analytics metrics you could build your own custom queries for example with Container Insights you have access to these data-collection and you could have your own Kusto Queries.
I think this Azure plugin for Grafana is interesting for different reasons:
- If you are already using Grafana, you could reuse your skills
- If you are looking for a single place to visualize your metrics, graphs, etc.
- Even if you could do that with Azure Monitor and Azure Dashboards, in that case you don’t need to have access to the Azure portal.
- If you are looking to expose dashboards to external users who don’t have access to your Azure subscription
Cheers!