cloud operations with gke
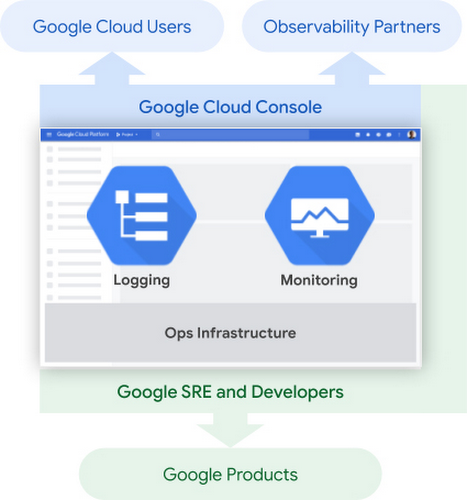
Cloud Operations (formerly known as Stackdriver) helps to monitor, troubleshoot, and improve application performance on your Google Cloud environment. It’s a combination of different features such as Cloud Logging, Cloud Monitoring, Cloud Trace, Cloud Debugger and Cloud Profiler and many more.
So, where to start with your GKE cluster? Actually, that’s pretty easy and straight forward! Checkout this blog article about Using logging for your apps running on Kubernetes Engine.
Cloud Logging, and its companion tool Cloud Monitoring, are full featured products that are both deeply integrated into GKE. In this blog post, we’ll go over how logging works on GKE and some best practices for log collection. Then we’ll go over some common logging use cases, so you can make the most out of the extensive logging functionality built into GKE and Google Cloud Platform.
By default, any GKE cluster is created with the option --enable-stackdriver-kubernetes and is provisioned with a pre-configured Fluentd-based collector that forwards logs to Cloud Logging. From there you could observe your GKE cluster with a pre-built GKE dashboard and GKE metrics. You could also create custom metrics, custom dashboards and alerts based on your containers, services, nodes, etc.
Here below are few queries I was able to run and leverage via the Cloud Logging - Logs Viewer Interface to get more insights about my GKE cluster, my containerized app deployed on GKE:
# Get deleted deployments:
resource.type="k8s_cluster"
resource.labels.location="us-east1-b"
resource.labels.cluster_name="mygkecluster"
protoPayload.methodName="io.k8s.apps.v1.deployments.delete"

# Get logs from myblog container:
resource.type="k8s_container"
resource.labels.cluster_name="mygkecluster"
resource.labels.namespace_name="default"
resource.labels.container_name="myblog"
And here below are few queries I was able to run to create custom charts and dashboards by leveraging Cloud Monitoring - Metrics Explorer:
# Get container restart count:
metric.type="kubernetes.io/container/restart_count"
resource.type="k8s_container"
metadata.user_labels."app.kubernetes.io/name"="myblog"

# Get container memory usage:
metric.type="kubernetes.io/container/memory/used_bytes"
resource.type="k8s_container"
metadata.user_labels."app.kubernetes.io/name"="myblog"

# Get container CPU usage time:
metric.type="kubernetes.io/container/cpu/core_usage_time"
resource.type="k8s_container"
metadata.user_labels."app.kubernetes.io/name"="myblog"

# Get container uptime:
metric.type="kubernetes.io/container/uptime"
resource.type="k8s_container"
metadata.user_labels."app.kubernetes.io/name"="myblog"
What’s missing here is metrics around the HTTP requests on my containerized app, but fortunately I’m able to get them via the HTTP(S) Load Balancing Logging and Monitoring features:
# Get total latency:
resource.type="https_lb_rule"
resource.labels.url_map_name="k8s-um-default-myblog--33c1aa2f7a9fd258"
resource.labels.project_id="mabenoit-myblog"
metric.type="loadbalancing.googleapis.com/https/total_latencies"

# Get requests count:
resource.type="https_lb_rule"
resource.labels.url_map_name="k8s-um-default-myblog--33c1aa2f7a9fd258"
resource.labels.project_id="mabenoit-myblog"
metric.type="loadbalancing.googleapis.com/https/request_count"
metric.labels.response_code_class!="0"
Another feature I find very valuable is the concept of service monitoring combined with the SLO API. I’m able to get another pre-defined dashboard for my Kubernetes services and actually from there I’m now able to define some SLIs/SLOs. To know more about SLO, I have found these resources below very insightful:
To determine if an SLO (Service Level Objective) is met/successful, you need a measurement. That measurement is called the SLI (Service Level Indicator). An SLI measures the level of a particular service that you’re delivering to your customer. Ideally, the SLI is tied to an accepted CUJ (Critical User Journey).
Have a look at how it’s easy to setup your SLOs for GKE services:
And that’s it for now, like you could see how easy it is to leverage the Cloud Operations Suite with GKE to get visibility about your GKE cluster and the containerized apps you deployed in it with no code changes. So no excuses to not leverage this from day 0! ;)
Complementary resources:
- SRE books
- StackDoctor on Youtube by Yuri Grinshteyn
- Setting up Cloud Operations for GKE
- 21 new ways we’re improving observability with Cloud Ops
- Qwiklabs - Google Cloud’s Operations Suite on GKE
- SLOs with Stackdriver Service Monitoring
- New ways to manage custom Cloud Monitoring dashboards
- Design patterns for exporting logging data
Happy monitoring and happy sailing! ;)